How to Evaluate Polymarket Traders
Polymarket's own leaderboard ranks wallets by one number: profit. That's a start, but profit alone can't answer the questions that actually matter. Did they make it on one lucky election bet or across a thousand independent markets? Did they sit through a 60% drawdown to get it? Is the "profit" banked, or is it a paper gain on open positions that could still go to zero?
Every Polymarket trade settles on the Polygon blockchain, which means every wallet's complete track record is public and verifiable. This guide walks through how to turn that raw history into the numbers a fund would ask for before allocating to a trader — because on-chain, you can.
Why the official leaderboard isn't enough
Three problems with ranking traders by profit alone:
- Profit scales with size, not skill. A wallet that deploys $10M at mediocre edge will out-rank a wallet compounding $50K brilliantly. Without a capital-relative view (drawdown as % of deployed capital, return on max drawdown), you're ranking bankrolls.
- Variance hides in the total. Two wallets with $5M profit are not equal if one grinded it over 900 active days and the other rode a single YES position through a coin-flip. The daily P&L path — not the endpoint — is where skill shows.
- Paper gains aren't banked gains. A total that's mostly unrealized P&L on open positions can evaporate at resolution. You want realized vs unrealized split out.
Step 1 — Rebuild true P&L from the chain
A wallet's position in any outcome token changes through five on-chain event types: order fills (trades on the CTF and NegRisk exchanges), splits (minting a YES/NO pair from USDC), merges (burning a pair back to USDC), redemptions (claiming payout after resolution) and conversions (NegRisk position transforms). Replay all of them in order and you get, for every token the wallet ever touched, its running amount and average cost basis.
From there, P&L splits cleanly in two:
| Component | When it books | How it's computed |
|---|---|---|
| Realized P&L | On every sell, merge or redemption | Sale/payout proceeds minus average cost basis of the shares disposed |
| Unrealized P&L | Marked daily on open positions | Shares held × (mark price − avg cost). Marked at last traded price; switches to the exact payout once the market resolves |
Summed per day, this produces a daily P&L series — total P&L, portfolio value, cost basis and open position count for every day of the wallet's life. That series is the raw material for everything in the next section. Building it is a replay: walk the wallet's events in block order, keep a running amount and average cost per token, and mark what's still open at the end of each day. Every input — the events and a daily_token_prices table with each token's last traded price per day — is in our daily Parquet dumps.
Step 2 — The metrics that separate skill from luck
With a daily P&L series in hand, the standard quant toolkit applies. One honest caveat first: a Polymarket wallet's cash balance isn't part of its on-chain trading history (USDC sitting idle is invisible to position events), so the capital base is unobservable. Ratios are therefore computed on dollar daily P&L rather than percentage returns — valid for comparing wallets of roughly stable size, and stated openly rather than pretending otherwise.
| Metric | What it tells you | What good looks like |
|---|---|---|
| Sharpe | Consistency: mean daily P&L over its volatility, annualized | > 1 sustained over hundreds of active days is strong for event-driven returns |
| Sortino | Same, but only penalizes downside days — kinder to lumpy winners | Meaningfully above the wallet's Sharpe means losses are small and controlled |
| Max drawdown ($) | Worst peak-to-trough fall of total P&L | Judge it against total profit: a $2M drawdown en route to $20M is discipline; en route to $3M is survival |
| Max drawdown (% of deployed capital) | Drawdown relative to the wallet's peak deployed capital (cost basis / portfolio peak) | Below ~30% suggests sizing discipline; above 70% means they nearly blew up |
| Days underwater | Longest streak below a prior P&L peak | Short streaks = fast recovery; a year underwater is a red flag even with a big total |
| Win rate | Share of active days that closed positive | 55–65% is typical for good directional traders; ~100% with tiny daily P&L usually means market-making, not forecasting |
| RoMaD | Annualized P&L over max drawdown — return per unit of worst pain | Higher is better; it's the single best one-number summary for sizing a copy-trade |
None of these metrics means much alone. The pattern to look for: large total P&L + Sharpe above 1 + drawdown a small fraction of profit + hundreds of active days. That combination is very hard to fake and very hard to luck into.
Reading a real whale
Here are the full P&L curves of two of Polymarket's top wallets as of July 2026, rebuilt day by day from on-chain events:
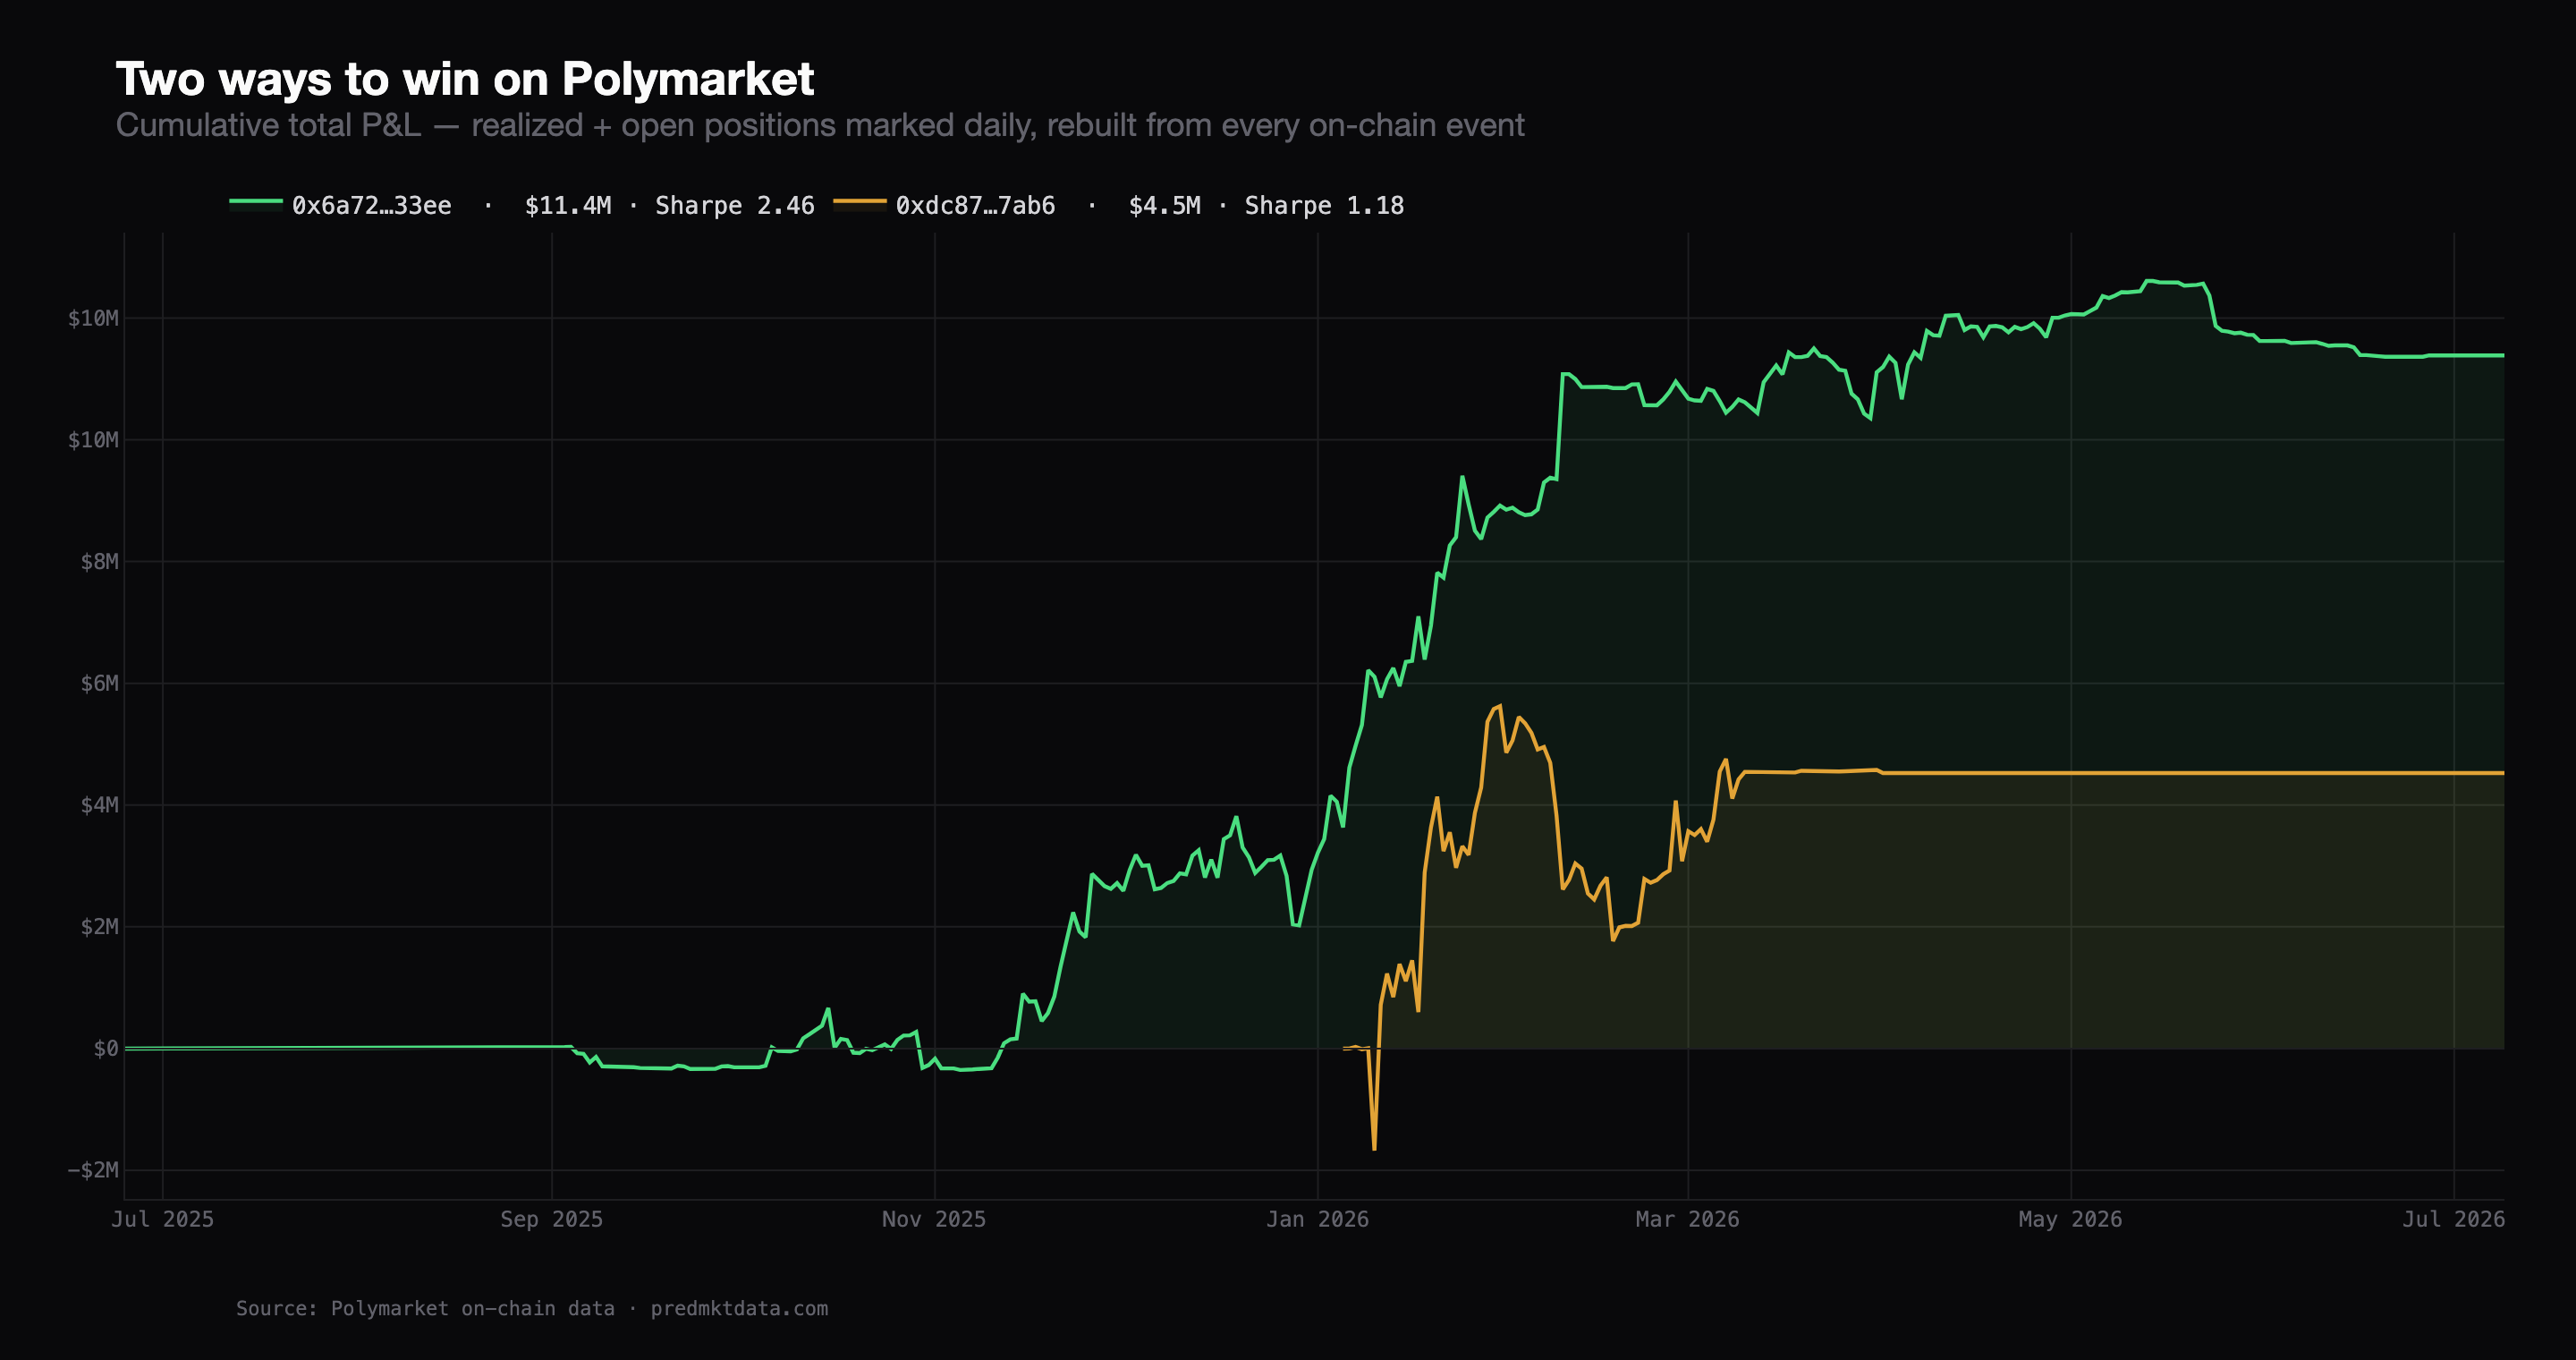
Two seven-figure winners, two completely different stories:
- The grinder (green, $11.4M). Six months of near-flat P&L while it found its edge, then a twelve-month compounding climb of hundreds of independent decisions. Sharpe 2.46, max drawdown just 5% of deployed capital, best day only +$1.7M against an $11.4M total — no single bet ever mattered too much. 113 positions were still open when we pulled the data. This is the profile a fund would underwrite.
- The survivor (gold, $4.5M). Started 2026 by digging a −$1.7M hole in its first weeks, clawed back to +$5.6M on huge swings, gave back a chunk, then banked $4.5M and went quiet — the flat tail means the profit is realized, not riding. Sharpe 1.18. The endpoint looks great; the path would have been very hard to sit through.
Total P&L alone would rank these wallets two rows apart and tell you nothing else. The curve — and the stats computed on it — is what separates a process from a survived gamble. For contrast, the #1 wallet at the time ($22.0M total) made +$24.8M on a single day, more than its lifetime total: one thesis, massive size, one resolution night. Copying that wallet means copying a bet, not a process. Every number here comes from public on-chain events, so you can reproduce it yourself from the dumps.
Red flags before copy-trading anyone
- Monster total, monster drawdown. If max drawdown is more than half of total P&L, you're looking at survived variance, not edge. You would have capitulated at the bottom.
- Unrealized-heavy totals. Paper gains on open positions can halve overnight at resolution. Check the realized/unrealized split.
- Short history. Fewer than ~90 active days tells you almost nothing; one hot streak dominates every metric.
- Near-100% win rate with tiny daily P&L. That's a market-making bot earning spread. Copying its fills without its infrastructure loses money.
- One-market concentration. A total built on a single election or sports final is a lottery ticket that hit. Breadth across markets is what generalizes.
- Stale wallets. Big historical P&L, nothing in 6 months — the trader may have moved to a fresh address. Check the last-activity date, not just the total.
Do it yourself — the data is public
Everything above is computable from public Polygon data, and the daily Parquet dumps hand you the inputs ready to query: every fill, split, merge, redemption and conversion since 2022, plus a daily positions snapshot with each wallet's average cost and realized P&L. A first screen is three DuckDB queries:
-- Run in DuckDB from the folder you downloaded the dumps into

-- 1. Realized P&L, open exposure and last activity per wallet
SELECT user_address,
       SUM(realized_pnl) / 1e6                         AS realized_pnl_usdc,
       SUM(amount / 1e6 * avg_price / 1e6)             AS open_cost_basis_usdc,
       COUNT(*) FILTER (WHERE amount > 0)              AS open_positions,
       MAX(last_block)                                 AS last_active_block
FROM 'positions/positions_current.parquet'
GROUP BY user_address
ORDER BY realized_pnl_usdc DESC
LIMIT 100;

-- 2. Unrealized P&L: mark open positions at each token's last traded price
WITH px AS (
  SELECT token_id, arg_max(price, day) AS price
  FROM 'daily_token_prices/*.parquet'
  GROUP BY token_id
)
SELECT p.user_address,
       SUM(p.amount / 1e6 * (px.price - p.avg_price / 1e6)) AS unrealized_pnl_usdc
FROM 'positions/positions_current.parquet' p
JOIN px USING (token_id)
WHERE p.amount > 0
GROUP BY p.user_address
ORDER BY unrealized_pnl_usdc DESC
LIMIT 100;

-- 3. History length, breadth and volume from the fills (all trading since Apr 28, 2026)
--    Group by maker: each wallet's part in each match is counted exactly once
SELECT maker AS wallet,
       COUNT(DISTINCT timestamp::DATE) AS active_days,
       COUNT(DISTINCT token_id)       AS tokens_traded,
       SUM(CASE WHEN side = 0 THEN maker_amount_filled
                ELSE taker_amount_filled END) / 1e6 AS volume_usdc,
       MAX(timestamp)                  AS last_trade
FROM 'order_filled_events_v2/*.parquet'
WHERE maker = '0x...'   -- drop this line to screen every wallet
GROUP BY maker;
Those three queries already cover most of the red-flag checklist: the realized/unrealized split, open exposure, breadth across markets, length of history and staleness. Two caveats: a resolved market's last traded price only approximates its payout, and for activity before April 28, 2026 you also need the v1 fills table (order_filled_events), where side is text and the token sits in maker_asset_id/taker_asset_id.
The risk metrics — Sharpe, Sortino, drawdown, days underwater, win rate — need the daily P&L series itself, which means the replay described in Step 1: walk each wallet's fills, splits, merges, redemptions and conversions in block order with average-cost accounting, and mark open positions every day with daily_token_prices. Every input for it is in the dumps, so cohort-level screens like "every wallet with Sharpe > 1 and 200+ active days" are within reach of a single machine.
Screen wallets like a fund would
Every fill, split, merge and redemption since 2022, plus a daily positions snapshot with average cost and realized P&L for every wallet — as Parquet files you query with DuckDB.
Subscribe to Lite — $49/mo →FAQ
How is Polymarket P&L calculated?
By replaying every on-chain event that changes a position — fills, splits, merges, redemptions, conversions — to maintain each token's amount and average cost basis. Realized P&L books on sells and redemptions against that cost basis; unrealized P&L marks open positions at the last traded price, switching to the exact payout once the market resolves.
Can I see the P&L of any Polymarket wallet?
Yes — everything settles on Polygon, so any wallet's complete track record is public. You can index the chain yourself, or start from our daily Parquet dumps, which already carry every fill since 2022 and each wallet's positions with average cost and realized P&L.
Why does on-chain P&L differ from the Polymarket profile page?
Mostly resolved-but-unredeemed positions: Polymarket's UI realizes P&L at market resolution, while the strict on-chain ledger realizes it at redemption. The numbers converge once the wallet redeems. On-chain reconstruction also retains full history where the public API caps and purges older positions.
What is a good Sharpe ratio on Polymarket?
Event-driven P&L is lumpier than equity returns, so treat equity intuitions with care. Sustained Sharpe above 1 across hundreds of active days is strong; combine it with drawdown below ~30% of deployed capital and a multi-hundred-day history before taking a track record seriously.